

To track user engagement and session data in Google Analytics 4, follow the steps below:
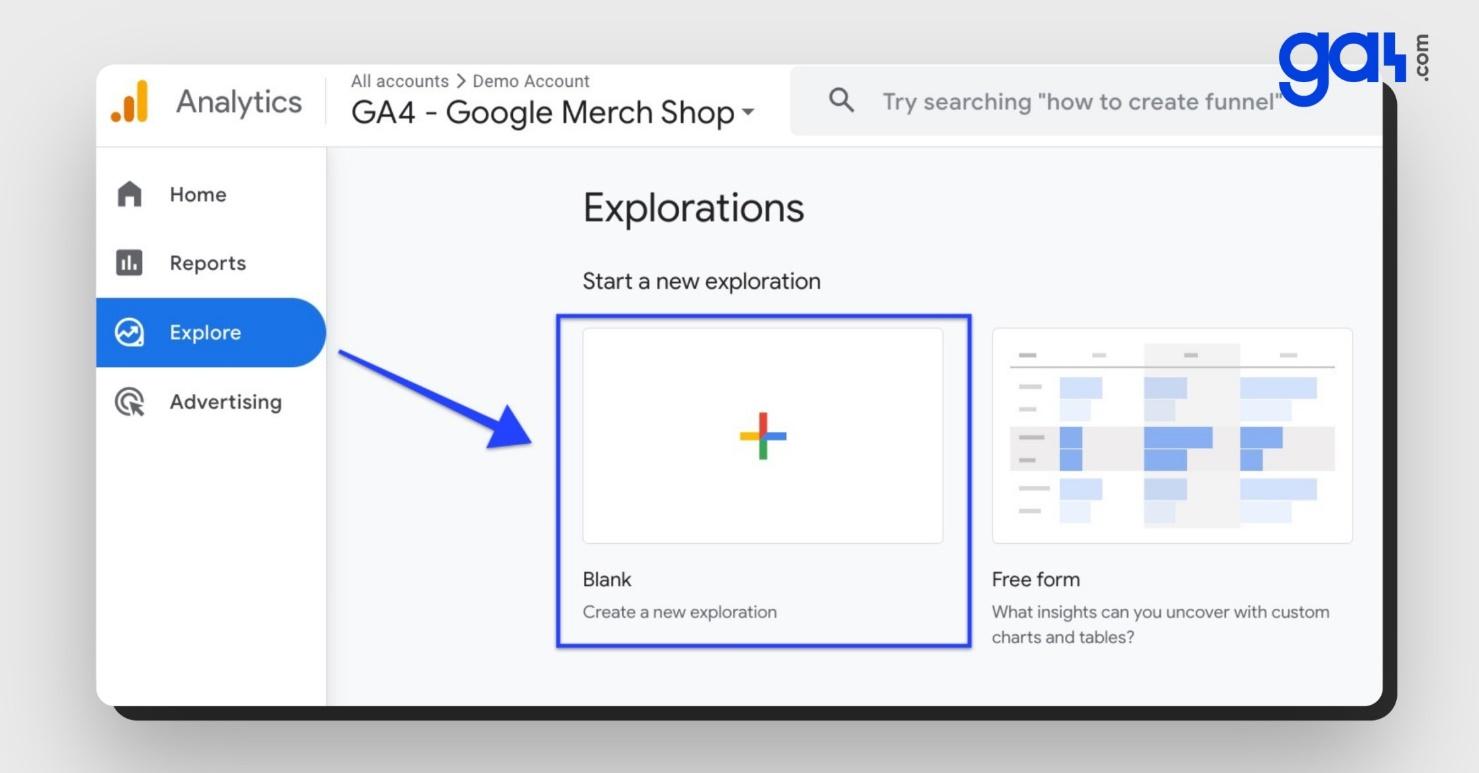
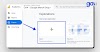
Step 1: Go to the Explore section in your Google Analytics 4 account, then click the blank template to create a new exploration.
Create new exploration
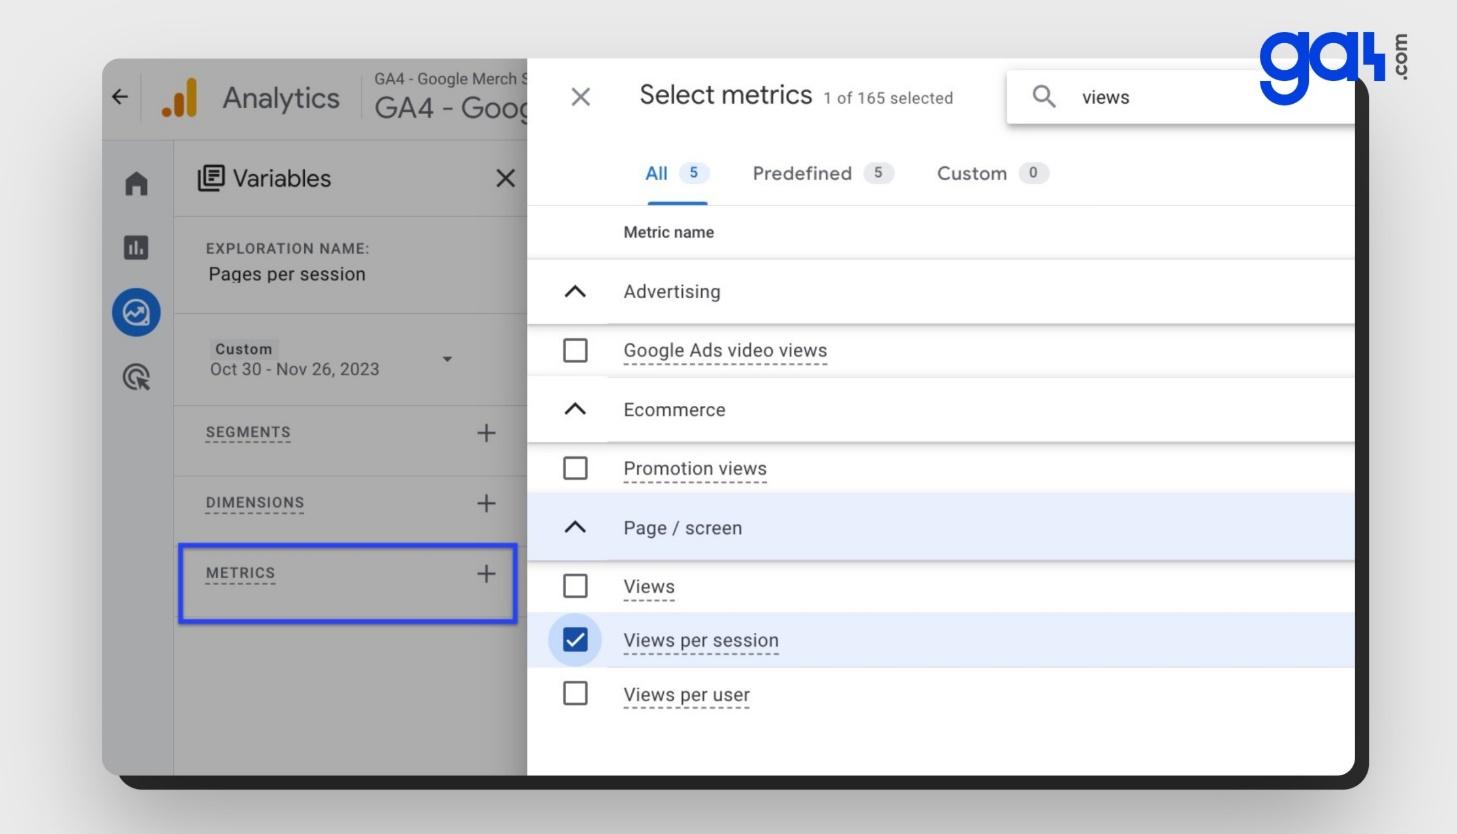
Step 2: To add metrics, click the plus sign. Find Views per session and check the box. Then, click Import. In the same way, you can add multiple metrics, such as average engagement time per session.
Add session metrics
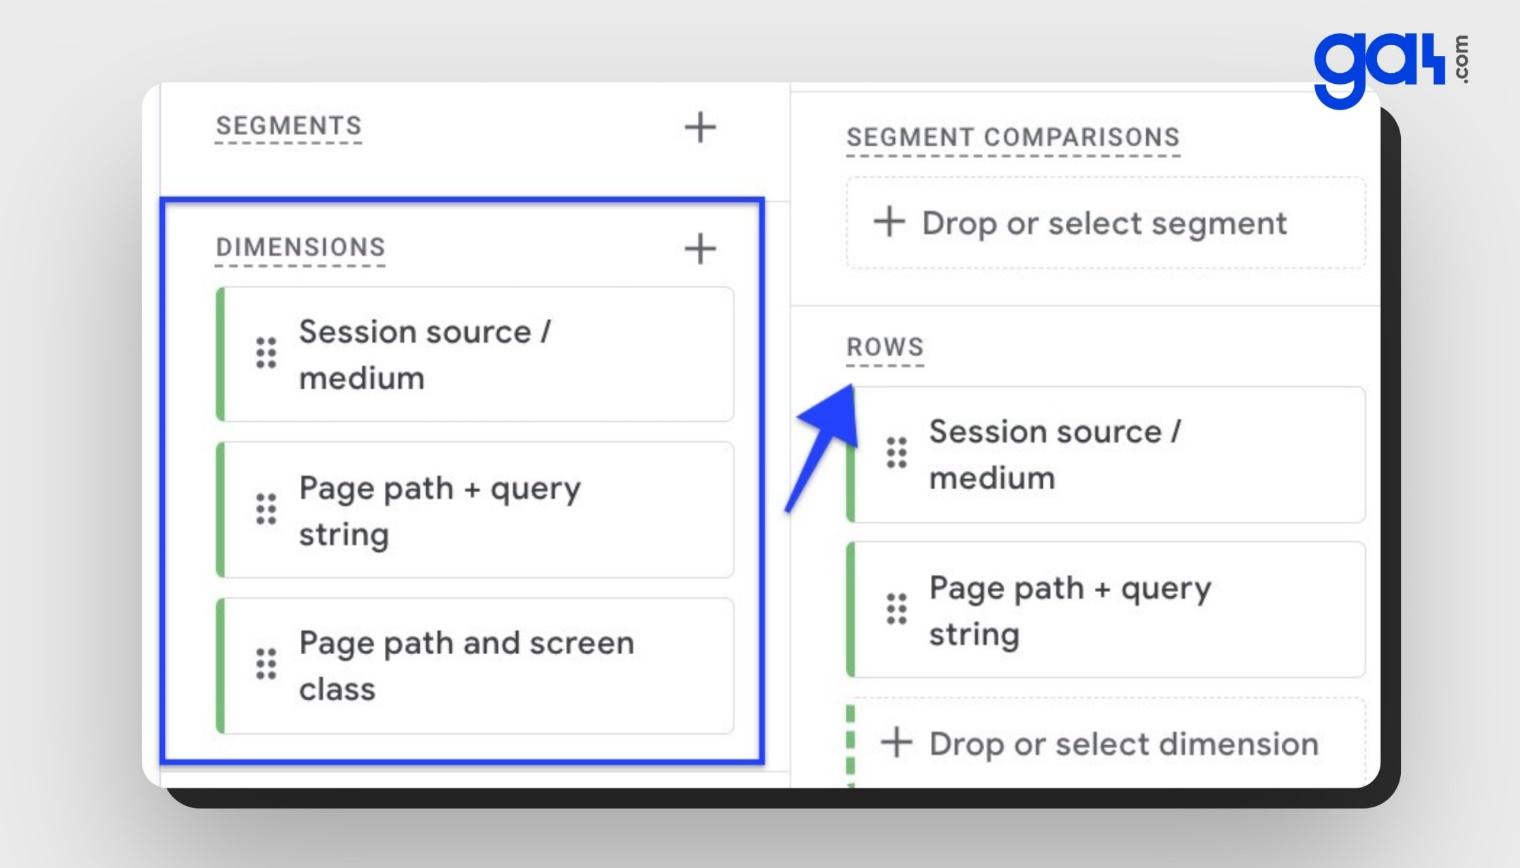
Step 3: Now, click the plus sign next to Dimensions. Find the following dimensions, check the boxes next to them, and import them into your report:
Session source/medium
Page path + query string
Page path and screen class
You can pick other dimensions that are important to your business.
Step 4: Move the dimensions to Rows. After that, move the metric "Views per session" to Values. You can move values by double-clicking on them or dragging them.
Add dimensions and move to the report
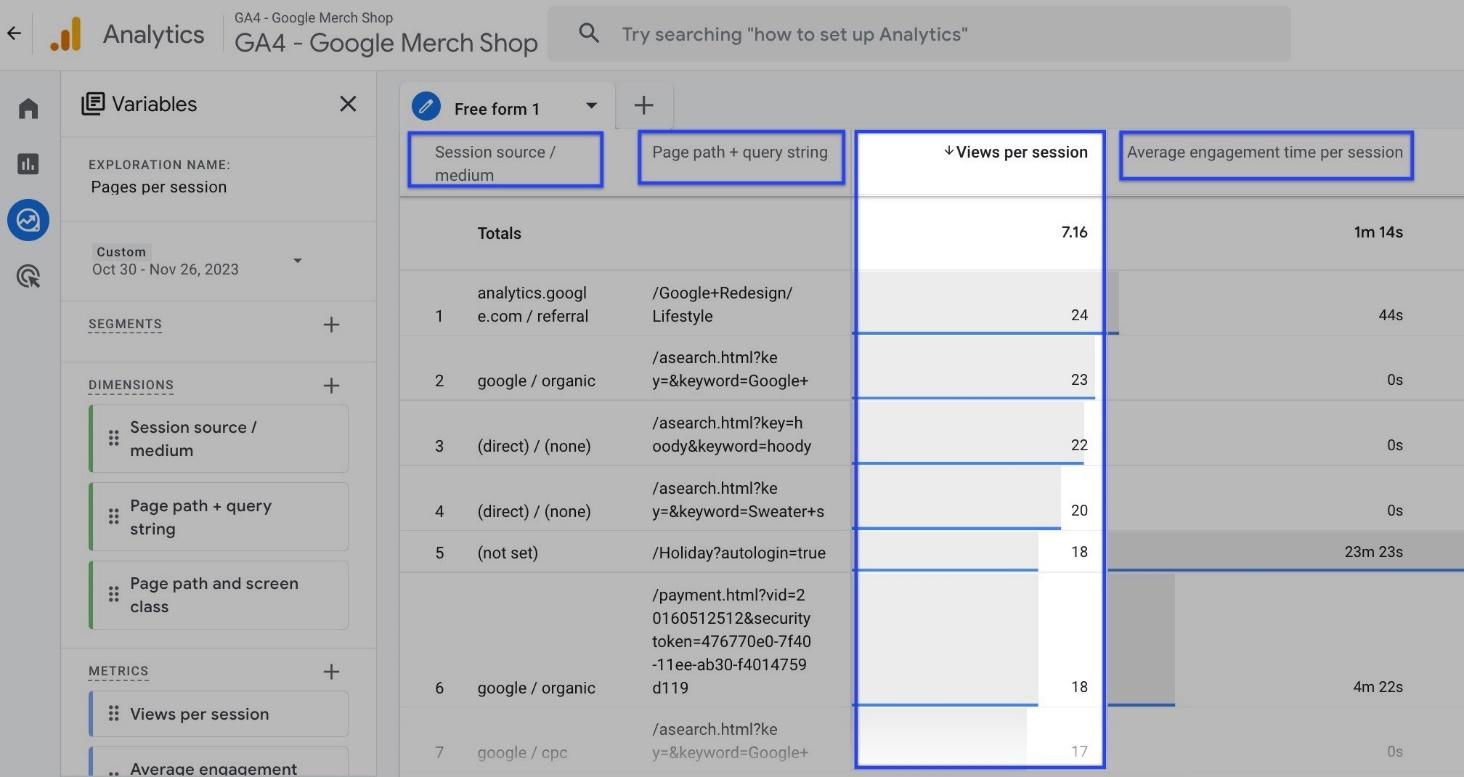
If you follow these steps correctly, you'll be able to see the number of views per session ( pages per session) as shown below.
Pages per session report
How Do You Calculate Pages Per Session?
To begin, you must first comprehend how GA4 defines a session. Google Analytics defines a session as the amount of time a user or visitor spends interacting with your website.
Here is a detailed guide to GA4 sessions, how they work, and so on.
Pages/session is calculated using the following formula:
Pages per session = the total number of page views / the total number of sessions.
For example, a user will usually view two pages before ending their session if the average is two pages per session in GA4.
To gain a better understanding, imagine a situation where a user goes to your website and navigates through four different pages. The pages per session value for that user in this case is 4. On the other hand, if a user only views one page during their visit, the page per session value would be 1.
Tip: GA4 also takes into account repeated views, so if your viewer clicks the back button to read something again, it contributes to the total number of views.
Why Should You Track Views Per Session?
The number of pages viewed on your website per session is a reliable indicator of content engagement and the quality of the visitor experience.
A high pages per session value shows that users are finding your website's material engaging and are motivated to explore more pages within your website.
A low pages per session value could indicate that users are not finding your content interesting or are facing difficulties while navigating your site.
You are now aware of the meaning of pages per session and alternative values for monitoring it in GA4.
Since new GA4 terms have been introduced to measure user engagement, you need to use views per session metric in addition to other engagement metrics in order to track pages per session.


.png)

.png)


0 Comments